NHCC Quick Facts
NHCC has compiled statistics and data into one, easy-to-use resource. Below you will find quick facts that provide the compiled statistics and data.
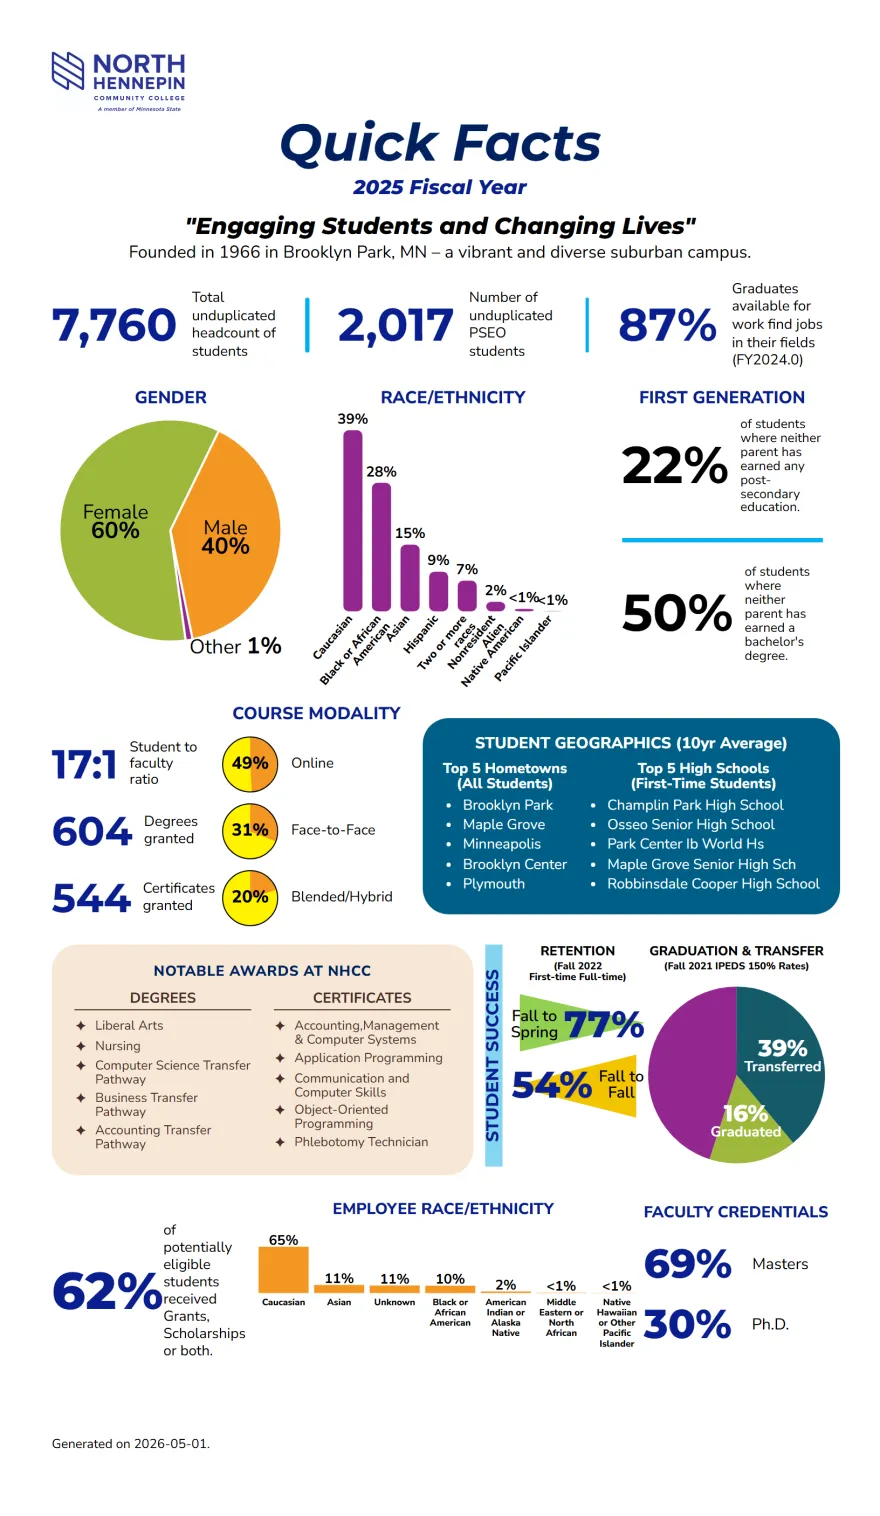
2025 Fiscal Year
"Engaging Students and Changing Lives"
Founded in 1966 in Brooklyn Park, MN – a vibrant and diverse suburban campus.
At a Glance (2025 Fiscal Year)
7,760 Total unduplicated headcount of students
2,017 Number of unduplicated PSEO students
87% Graduates available for work find jobs in their fields (FY2024)
Gender
60% Female
40% Male
1% Other
Race/Ethnicity
39% Caucasian
28% Black or African American
15% Asian
9% Hispanic
7% Two or more races
2% Nonresident Alien
<1% Native American
<1% Pacific Islander
First Generation
22% of students where neither parent has earned any post-secondary education.
50% of students where neither parent has earned a bachelor's degree.
Institutional Metrics
17:1 Student to faculty ratio
604 Degrees granted
544 Certificates granted
Course Modality
49% Online
31% Face-to-Face
20% Blended/Hybrid
Student Geographics (10yr Average)
Top 5 Hometowns (All Students)
Brooklyn Park
Maple Grove
Minneapolis
Brooklyn Center
Plymouth
Top 5 High Schools (First-Time Students)
Champlin Park High School
Osseo Senior High School
Park Center Ib World High School
Maple Grove Senior High School
Robbinsdale Cooper High School
Notable Awards
Top Degrees
Liberal Arts
Nursing
Computer Science Transfer Pathway
Business Transfer Pathway
Accounting Transfer Pathway
Top Certificates
Accounting,Management & Computer Systems
Application Programming
Communication and Computer Skills
Object-Oriented Programming
Phlebotomy Technician
Retention
(Fall 2022 First-time Full-time)
77% Fall to Spring
54% Fall to Fall
Graduation & Transfer
(Fall 2021 IPEDS 150% Rates)
39% Transferred
16% Graduated
Grants & Scholarships
62% of potentially eligible students received Grants, Scholarships or both.
Employee Race/Ethnicity
65% Caucasian
11% Asian
11% Unknown
10% Black or African American
2% American Indian or Alaska Native
<1% Middle Eastern or North African
<1% Native Hawaiian or Other Pacific Islander
Faculty Credentials
69% Masters
30% Ph.D.
Generated on 2026-05-01.
Enrollment
- 7,229 unduplicated headcounts
- 3,011 FYE students
Demographics
- 29% full-time students, 71% part-time (Fall 2023)
- 52% new students, 47% returning
- 59% female, 40% male
- 51% age 18-25, 25% age 26-older
- 23 average age
- 20 median age
- 56% BIPOC
- 32% low income (Pell eligible)
- 50% first generation (federal definition)
- 22% first generation (MN definition)
- 65% underrepresented (MN definition)
- 39.8% Caucasian
- 26.5% Black or African American
- 14.5% Asian
- 8.7% Hispanic
- 5.6% Two or More Races
- 2.1% Non-Resident Alien
- 0.4% Native American
- 0.01% Pacific Islander
- 28 International students
- 198 EAP students
Average Credit Load (Fall 2023)
- 13.5 credits Full-time students
- 6.2 credits Part-time students
- 8.3 credits all students
Average Class Size
- 21.4 Students
Course Sections Offered
- 1,336 total course sections (Enroll trends 2)
- 33% Traditional/classroom
- 50% Online
- 17% Hybrid/Blended
Top 5 Cities – Student Residence (Fall 2023)
- Brooklyn Park
- Maple Grove
- Minneapolis
- Brooklyn Center
- Plymouth
Top 5 Sending High Schools (Fall 2023 First Time Students)
- Park Center Ib World High School
- Champlin Park High School
- Osseo Senior High School
- Maple Grove Senior High School
- Robbinsdale Armstrong High School
Top 5 Declared Majors
- Liberal Arts
- Pre-Nursing
- Computer Science Transfer Pathway
- Business Transfer Pathway
- Biology Transfer Pathway
Top 3 Degrees Granted
- Liberal Arts and Sciences
- Nursing (MANE)
- Nursing
Top 3 Certificates Granted
- Communication and Computer Skills
- Accounting Management and Computer Information Systems
- Building Inspection
Retention Rates
(Fall 2021 entering first-time full-time students)
- 76.1% retained to first spring
- 52.5% retained to second fall
IPEDS 3-Year Graduation & Transfer Rates
(Fall 2020 entering first-time full-time students; 150% of normal time)
- 16% graduated
- 39% transferred
Financial Aid (Undergraduates)
Based on 2024 Award Year, from Fall 2023 to Summer 2024
(COVID-related Grants were not included)
- 4,044 Potentially Eligible Students
- 2,077 (51.4%) Students received Grants
- 898 (22.2%) Students received Loans
- 401 (9.9%) Students received Scholarships
- 2,264 (56.0%) Students received Grants or Scholarships or both
- $4,046 Average Grant Aid
- 2.5 official cohort default rate for FY2020 cohort
- 4,169 Potentially Eligible Students
- 2,204 (52.9%) Students received Grants
- 939 (22.5%) Students received Loans
- 502 (12.0%) Students received Scholarships
- 2,492 (59.8%) of Potentially Eligible Students received Grants or Scholarships or both
- $4,367 Average Grant aid
- 0.0% official cohort default rate for FY2020 cohort